From a question to a working view of the evidence.
These captures show the current Plynth workspace across AI conversation, reports, GIS, analysis canvases and reusable recipes. Generated data views and roadmap capabilities are separated and labelled below.
Visible in the authenticated app or shared workspace today.
Implemented views still passing authenticated workflow and release checks.
Planned capability, not presented as available now.
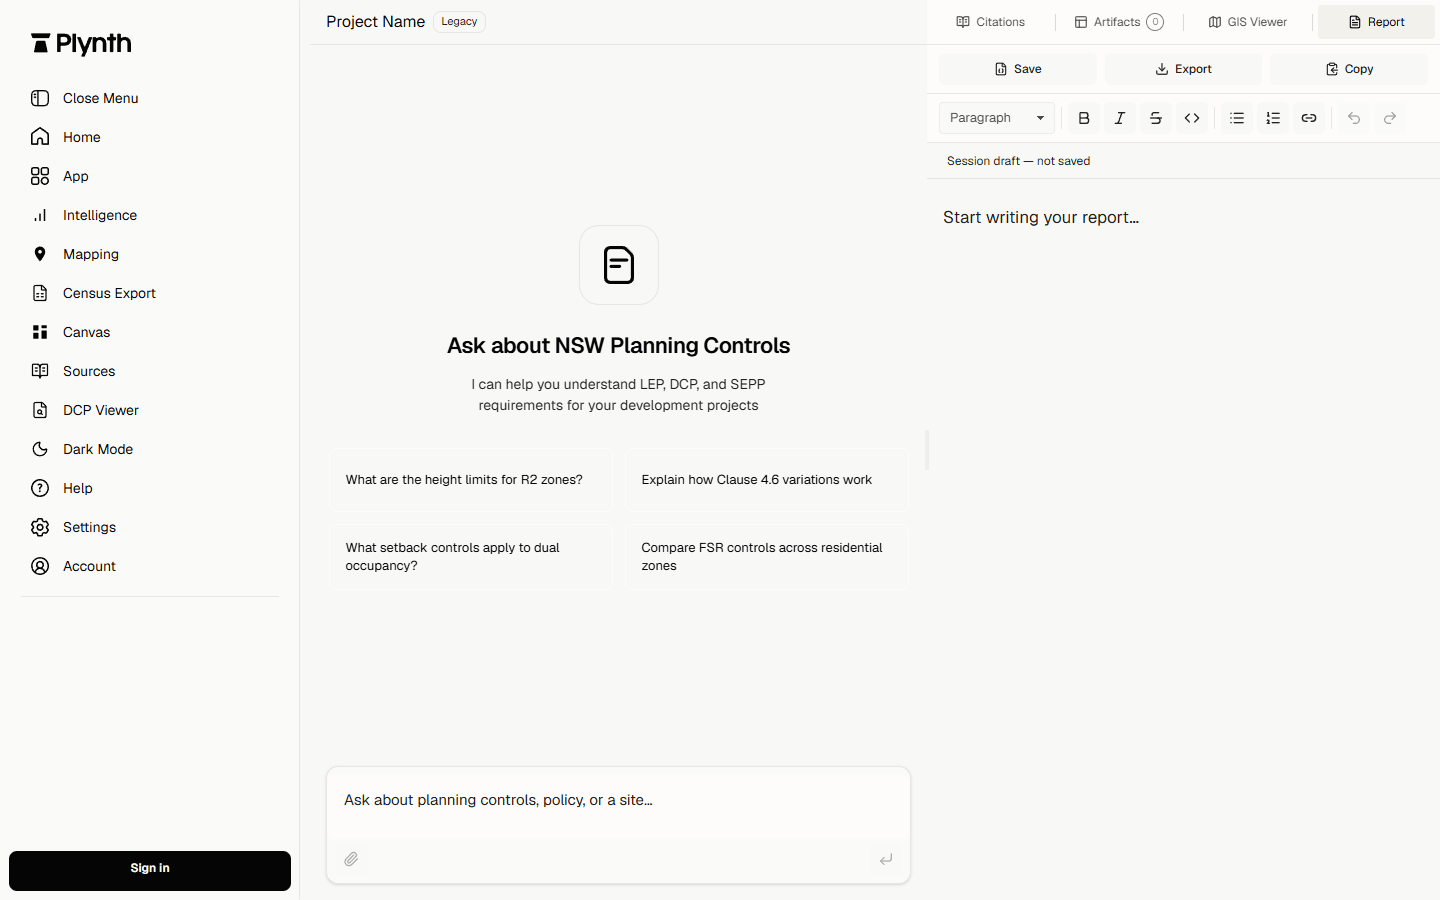
Ask the question. Build the report beside it.
Work through a planning or property question in conversation, inspect the cited evidence, then draft and edit the report in the same workspace.
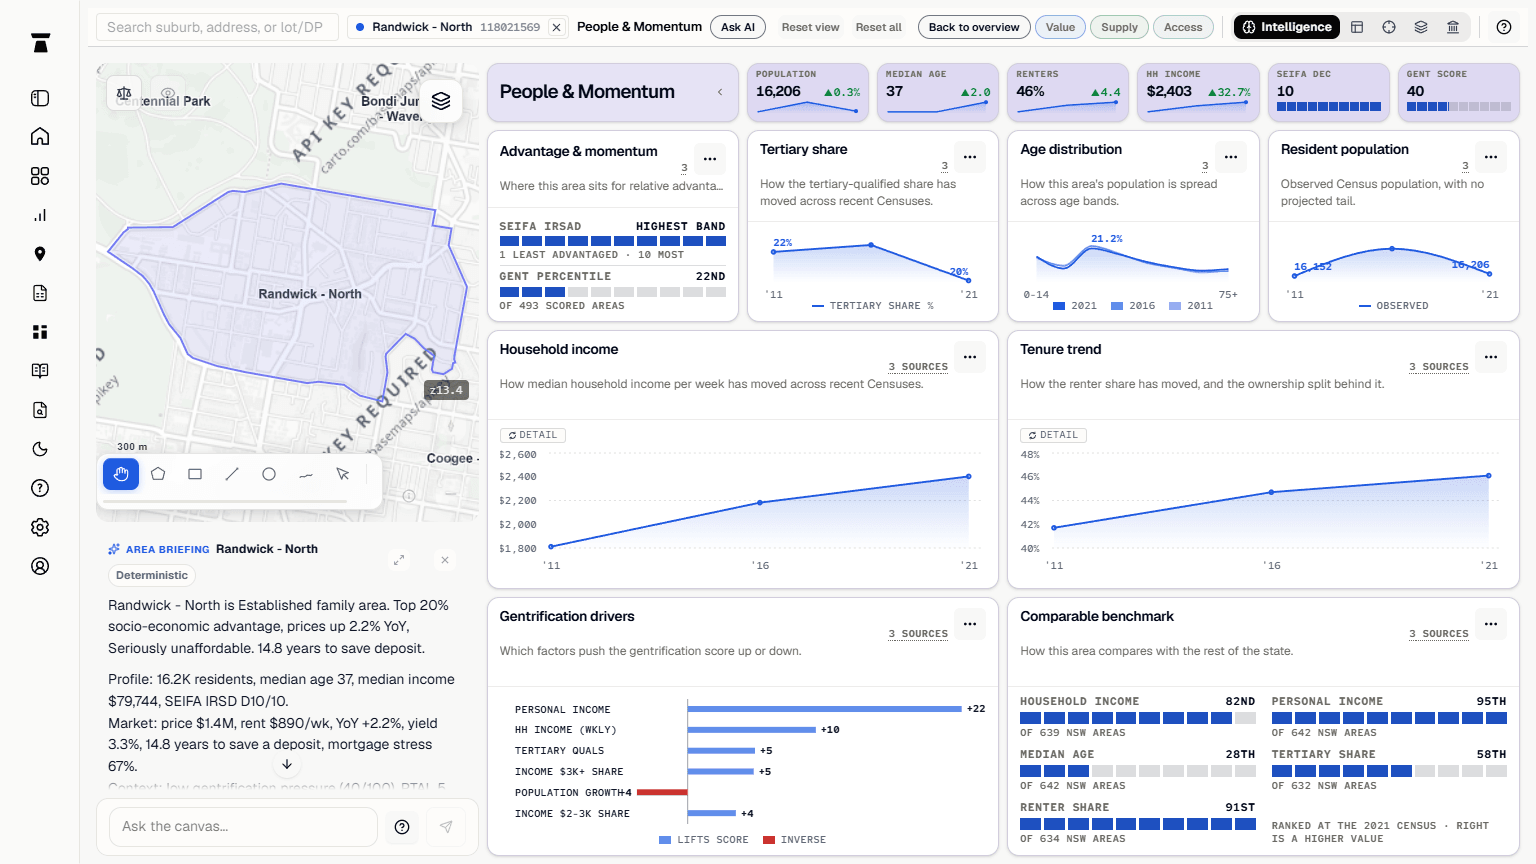
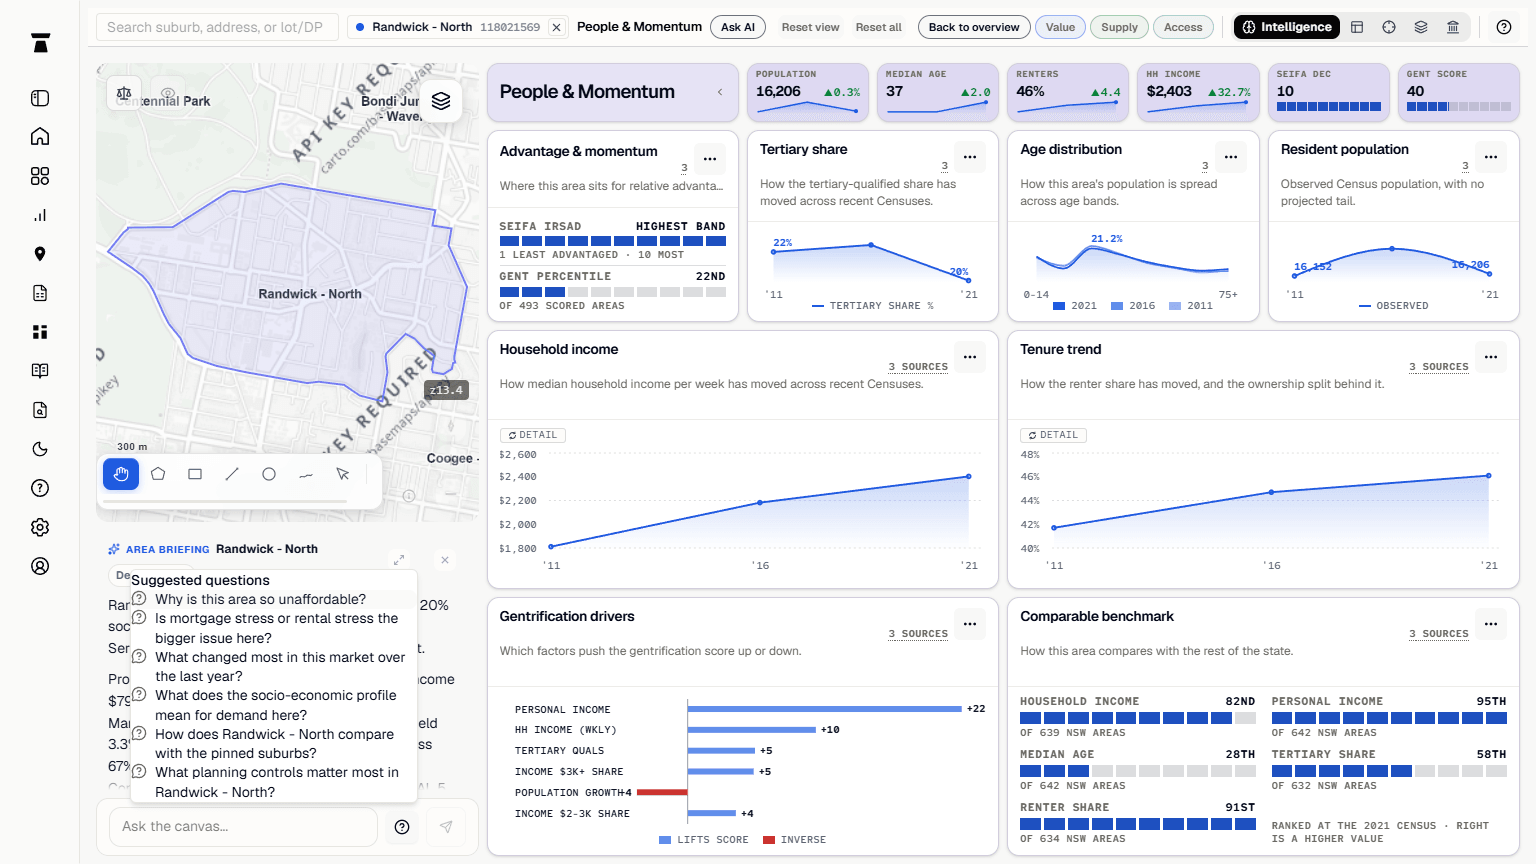
Test a thesis across people, place and momentum.
Use the selected geography to compare population, tenure, income, socio-economic advantage and gentrification drivers. Open the suggested-question menu when you want a sharper next question without leaving the canvas.
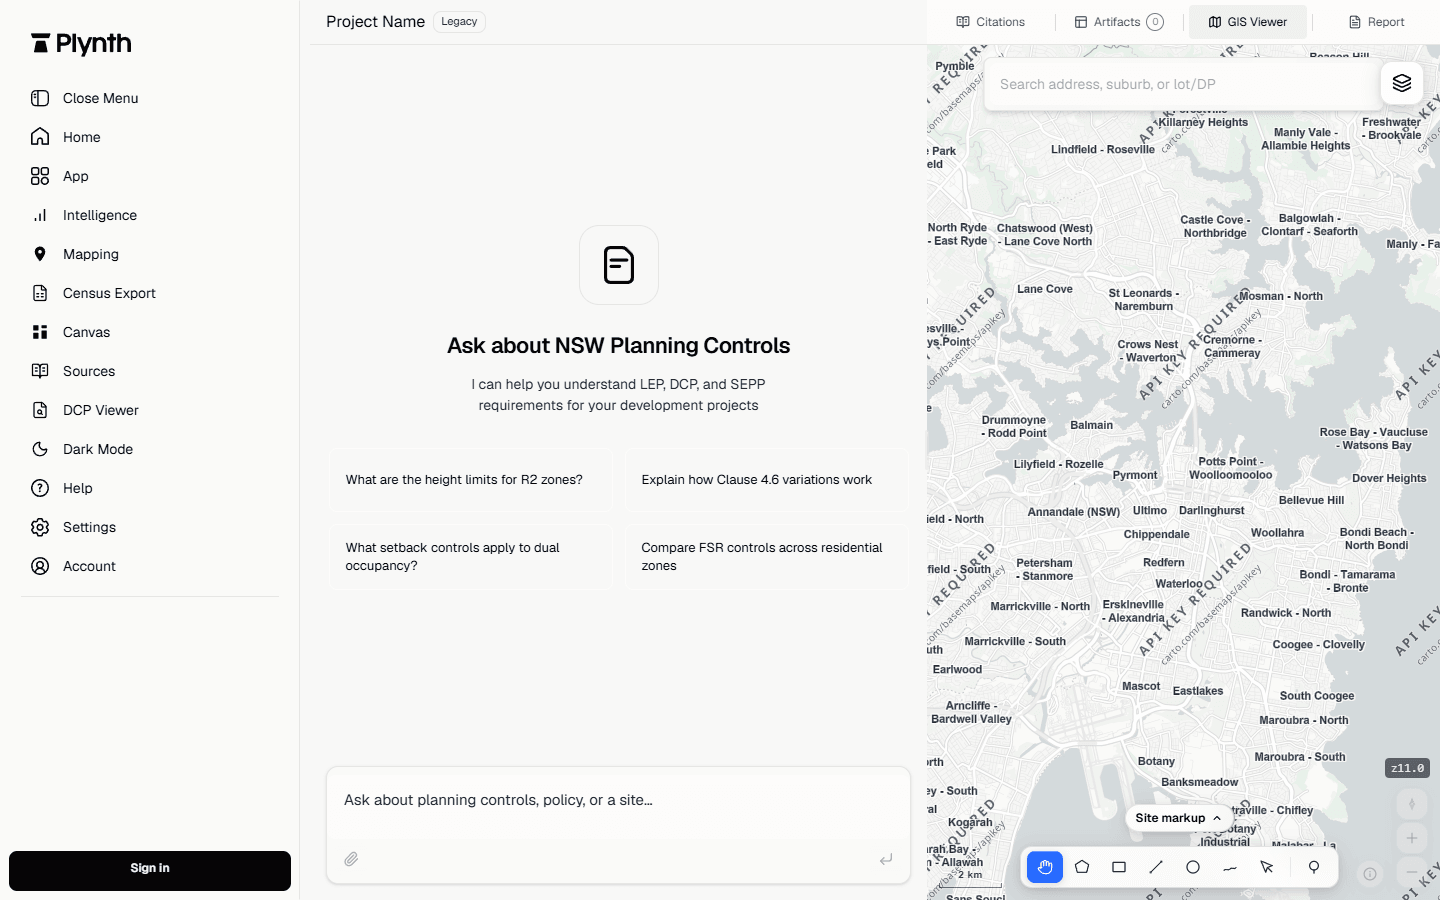
Move between the conversation and the map.
Search an address, navigate layers and draw the geography that matters without leaving the investigation.
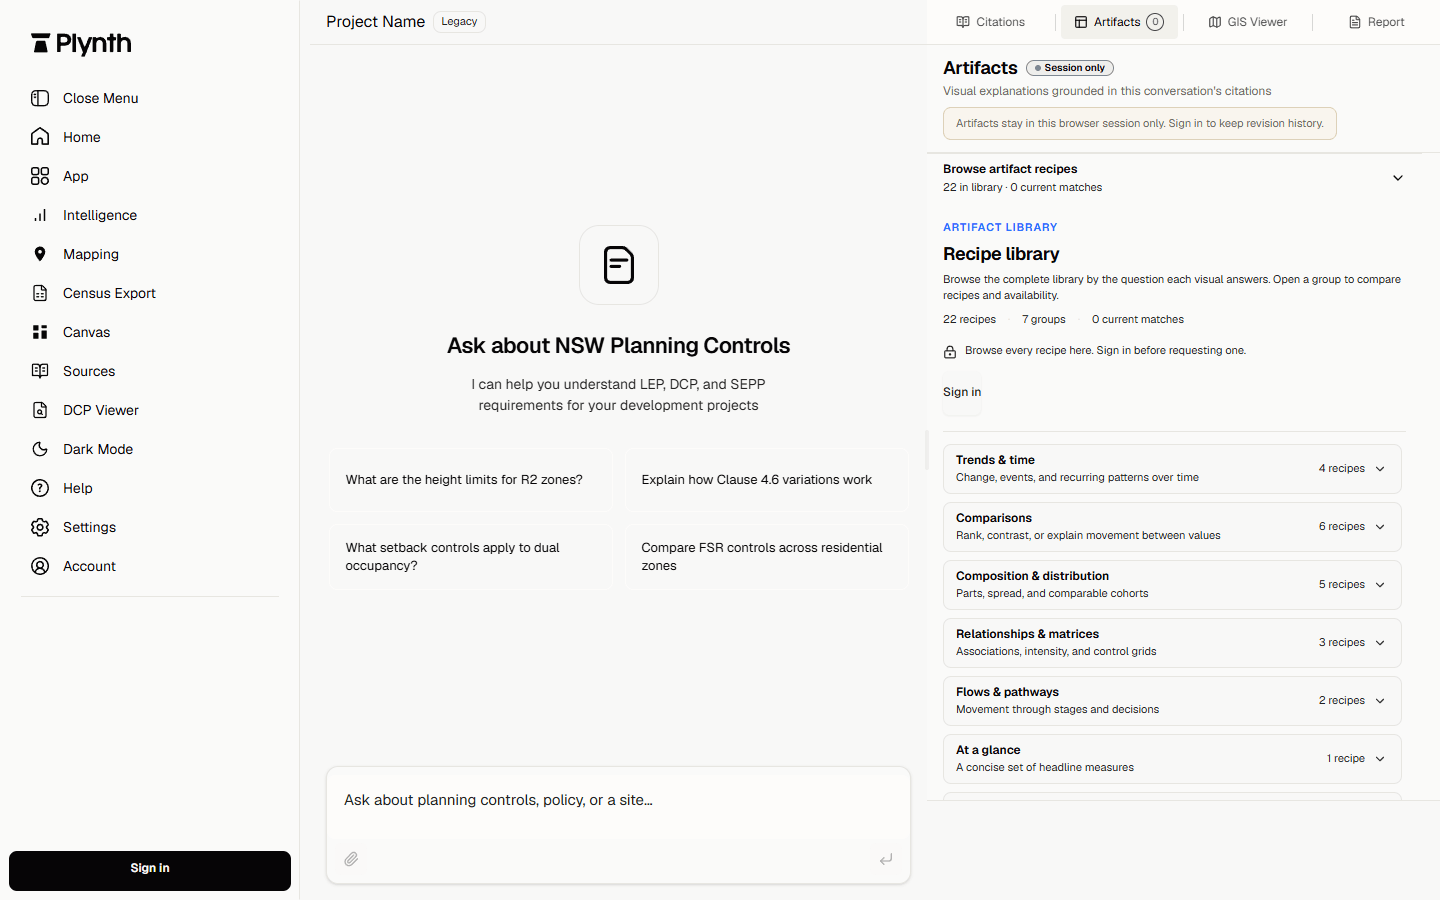
Start with a reusable analysis recipe.
Browse 22 recipes grouped around comparisons, trends, spatial questions, planning controls and decisions. Sign in when you are ready to request one.
See the pattern. Test the thesis. Keep the proof.
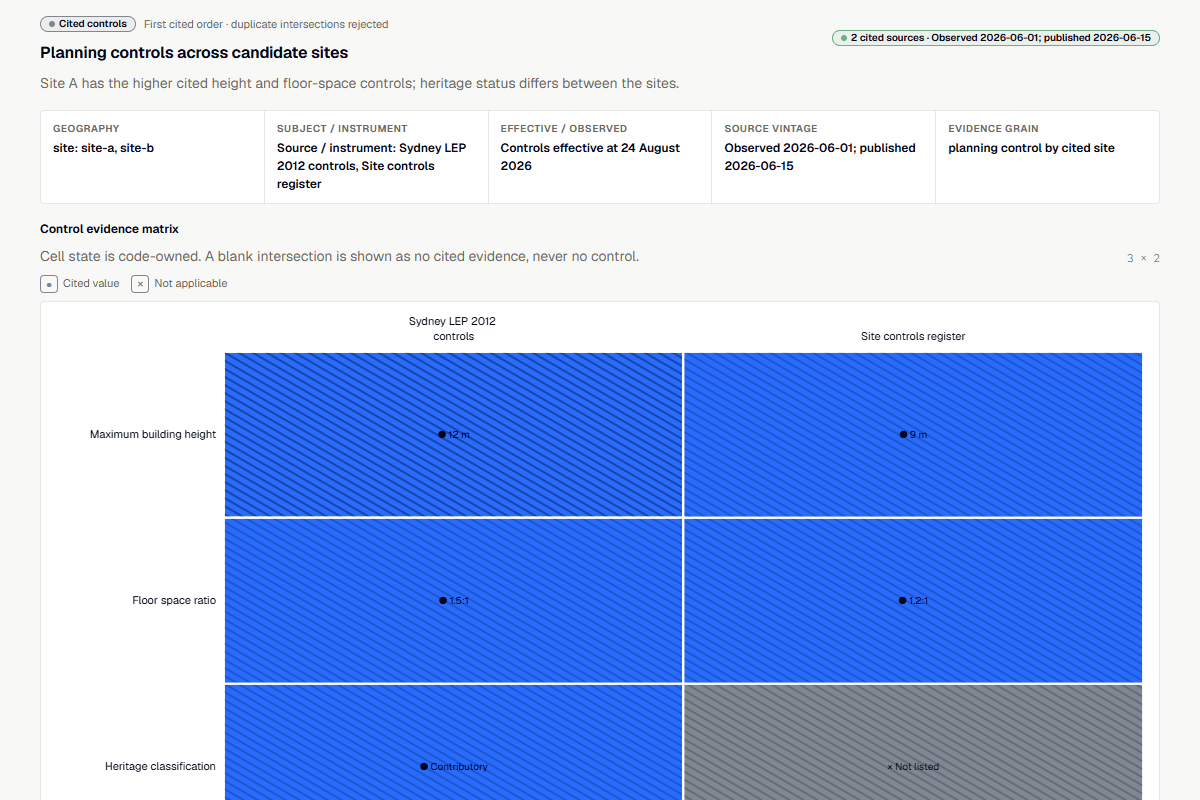
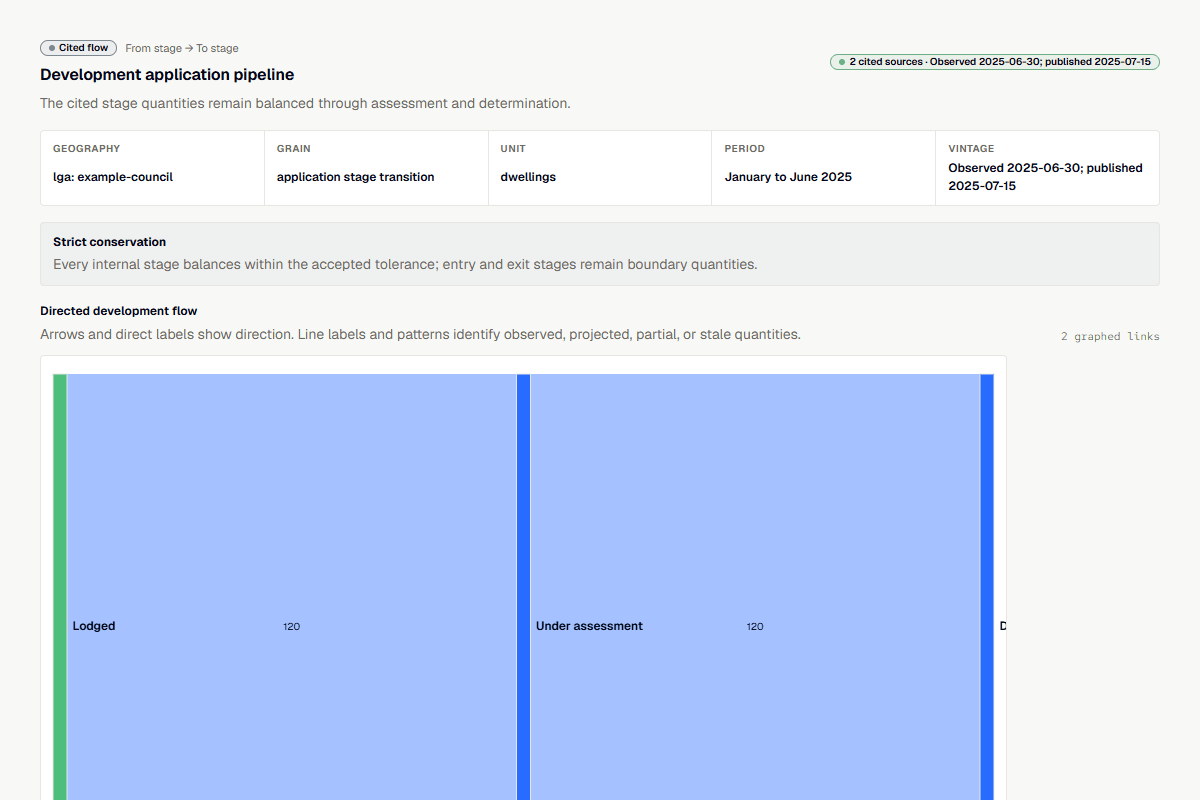
Ask for the same cited evidence as a comparison, planning matrix, development pipeline, trend or map. Each view keeps its sources, vintage, coverage and accessible table attached, so the analysis can be checked and carried into the next decision.
Carry a proven process into the next project.
On the roadmap: turn a proven analysis process into a reusable workflow, then bring project-specific data and context into future runs. This includes persistent project context from uploaded documents and datasets, user-authored executable skills and dependable multi-step workflows across that context.