Planning data analysis tools for comparing places and testing a question
Plynth supports planning data analysis by fixing the geography and question before comparing measures across places. Units, periods, sources and missing values remain visible beside the result.
The workflow helps test a planning thesis. It does not turn a place comparison into a valuation, investment recommendation, causal claim or forecast.
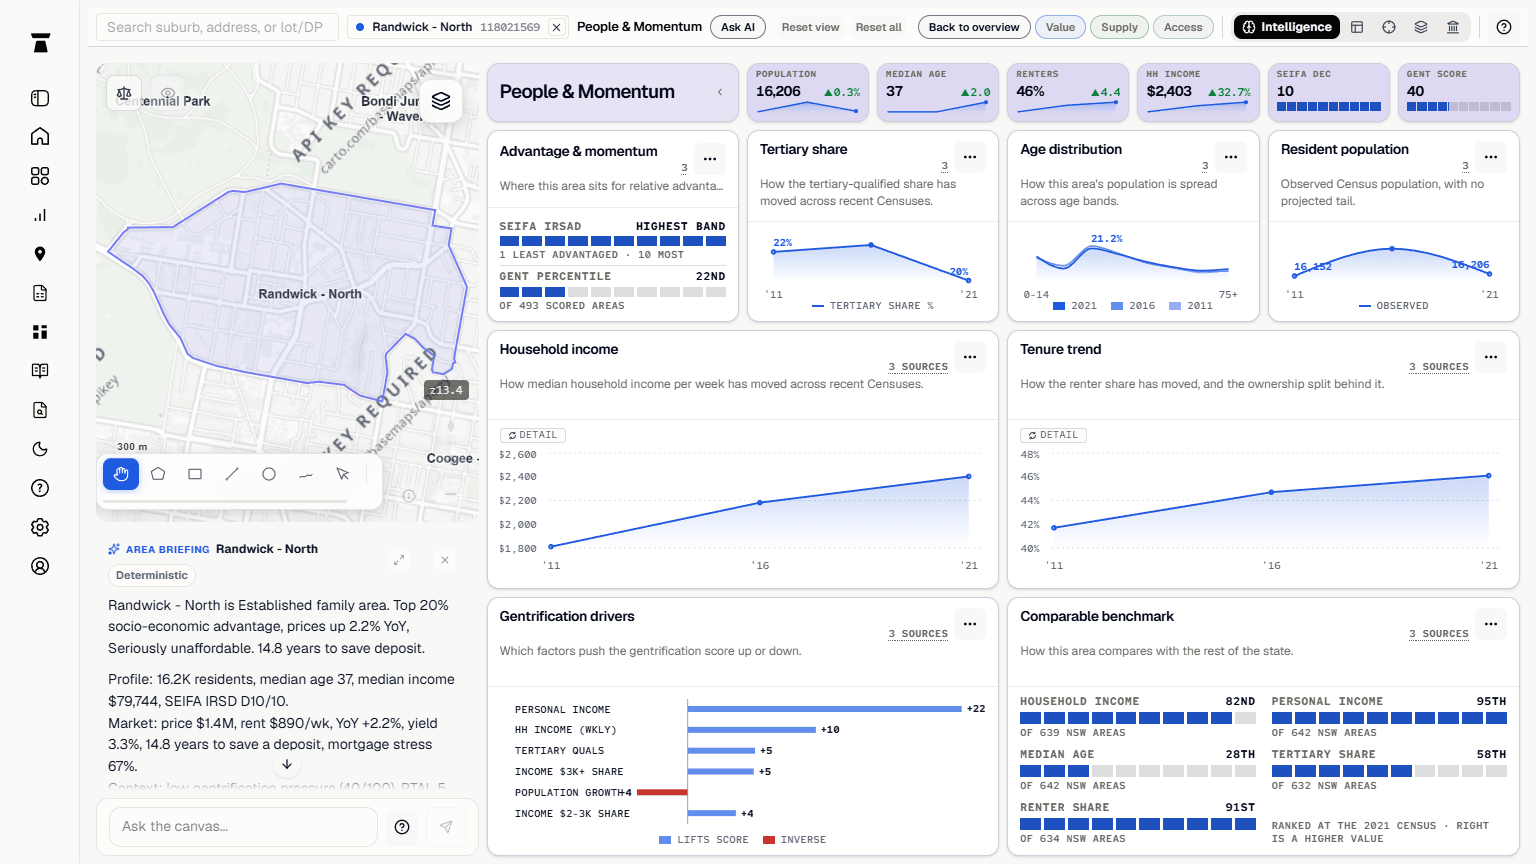
Choose the geography and question before choosing the metric.
A suburb, SA2, LGA, corridor and drawn area are not interchangeable. The analytical boundary should match the planning question and remain visible throughout the comparison.
Starting with the question also prevents an available metric from becoming a proxy for something it cannot measure.
Keep the unit, period and source attached to every measure.
A number without its unit, reference period and geography cannot be compared safely. Plynth retains that context and shows missing values rather than treating them as zero.
When source periods differ, the comparison says so. A current planning map and a five-year Census release answer different temporal questions.
Use planning, housing, transport and development signals together.
A place question can require several evidence layers: current housing stock, household change, transport access, planning controls and development activity. Keeping them together makes differences easier to interrogate.
The measures remain separate evidence. Combining them does not create a single objective score for a place or site.
Keep observation separate from inference.
The source may establish that two places have different measured characteristics. The explanation for that difference is an inference that needs additional evidence and stated assumptions.
Plynth keeps both layers visible so a reader can challenge the interpretation without losing the underlying observation.
Western and Eastern Sydney begin from different housing stocks.
The Sydney Plan's 2026 stock estimate reports 80% detached housing in Western Sydney and 73% attached housing across three categories in Eastern Sydney (South). This comparison identifies different starting points; it does not prescribe a future mix.
| Subject | Finding | Source | Boundary |
|---|---|---|---|
| Western Sydney | 80% detached housing in the 2026 stock estimate. | The Sydney Plan, Figure 20 | Regional estimate, not a parcel capacity or housing target. |
| Eastern Sydney (South) | 73% attached housing across low-, mid- and high-rise categories. | The Sydney Plan, Figure 20 | The combined share does not describe tenure, price or feasibility. |
| Observation | The two regions have materially different 2026 housing-stock baselines. | Plynth transcription and comparison of the same official figure | A regional contrast does not establish the cause of the difference. |
| Next test | Add local household, centre, transport and feasibility evidence. | Plynth planning-analysis method | No single chart decides the right local housing mix. |
What this workflow does not establish.
- Statistical geographies are analytical boundaries and may not match legal, cadastral or commonly used place boundaries.
- The comparison does not establish causation, forecast an outcome or recommend an investment.
- Data sources update on different cycles; each measure needs its own vintage and missing-value state.
Check the source and its date position.
These sources support the public explanation and worked specimen. The official publisher remains the authority.